Designer & Builder · Personal Project

Background
A timetable made for a station wall
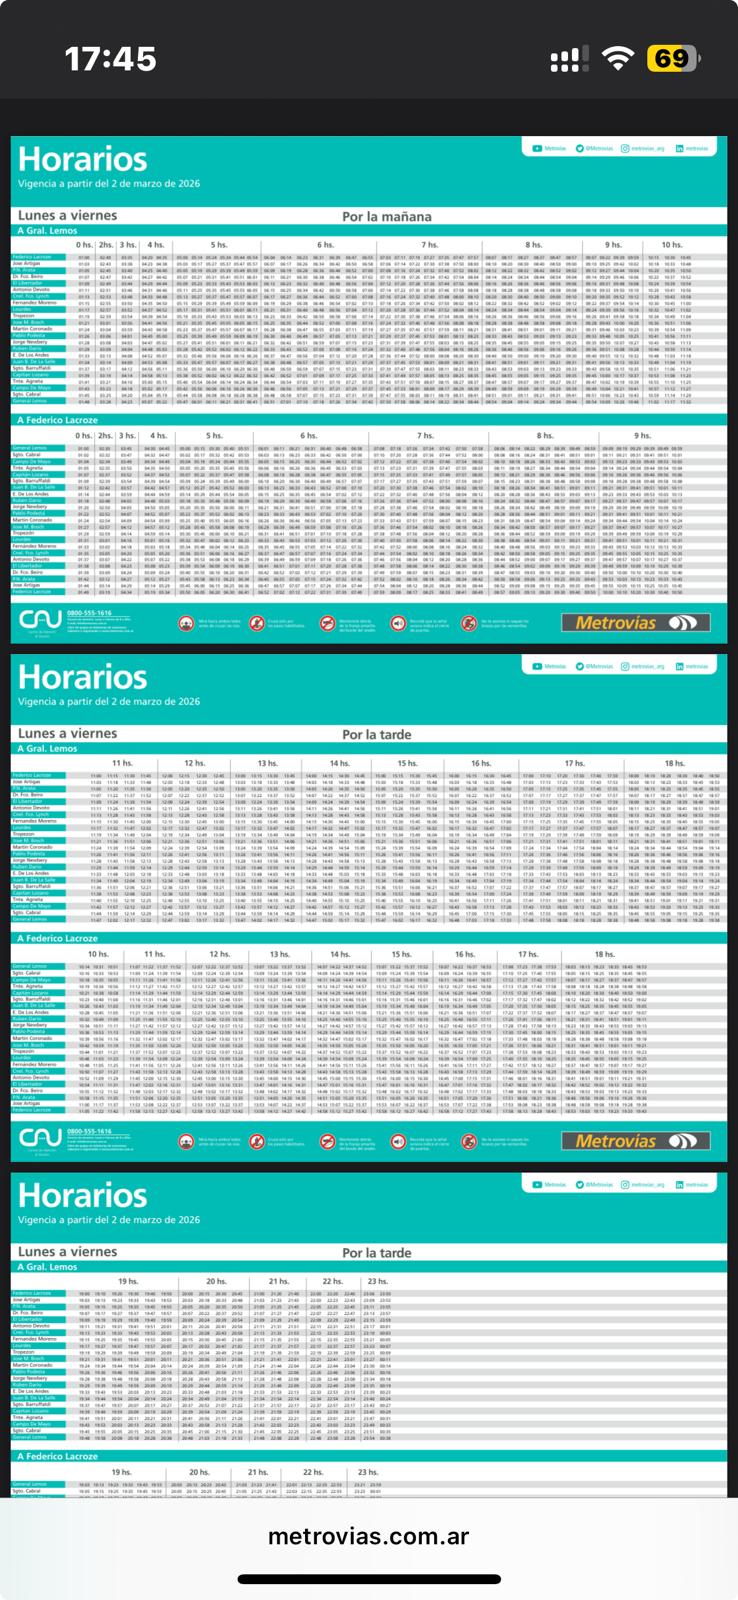
Metrovías publishes the Urquiza line's timetable as a PDF. It's the same grid they print and hang in stations: a row for each of the 23 stations and a column for every train, one grid per direction. In the web version, weekdays alone take three pages.
I ride the line to Hurlingham to see my girlfriend. Every trip started with that PDF on my phone: zoom in, find my station's row, find the hour, read across. So in March 2026 I built the page I wanted. You pick two stations and it shows you the next trains. It's been live at trenurquizahorarios.ar since then.
"When's the next train coming?"
What I wanted to know on every trip
Problem
What the PDF asks of a rider
I was the first user, so the research started with the PDF itself: every step it takes before you know when to leave.
📄 PICK THE RIGHT PAGE
Weekdays run across three pages, split by time of day. You need to know which day type applies, and whether today's a holiday.
🚉 FIND YOUR STATION
Each direction lists the 23 stations in the order the train reaches them, so your station's row moves depending on which way you're going.
⏱️ SCAN FOR THE NEXT TRAIN
Trains are grouped under hour headings. You find the hour, scan for the first time after now, and work out the wait yourself.
Solution
🚉 TWO STATIONS AND A TIME
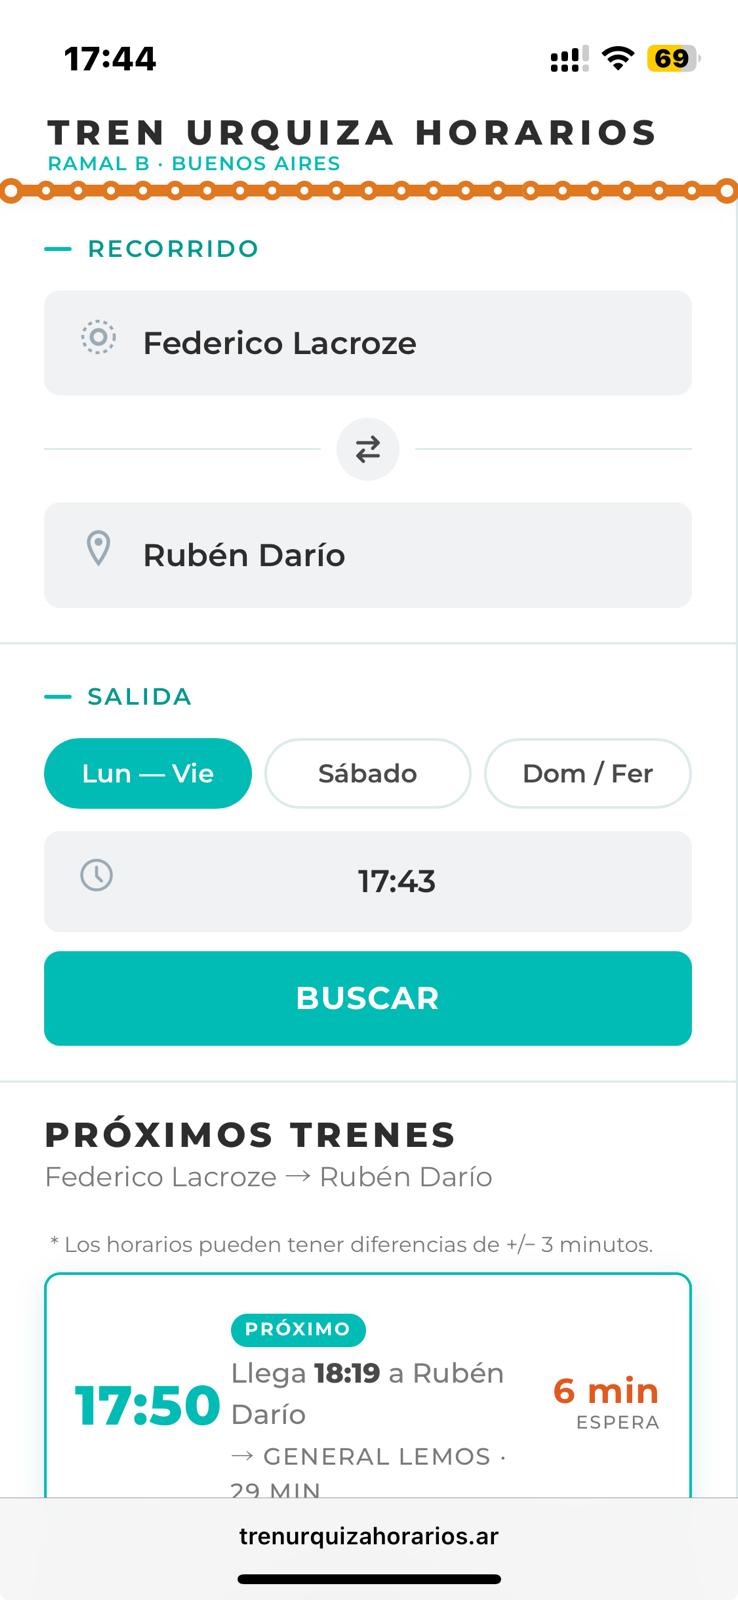
The next trains between any two stations, with the minutes until each one leaves.
The page reads today's date and picks the day type, and it knows the 2026 national holidays. It sets the time to now. You pick where you're getting on and off, and it works out the direction. Each result shows the departure, the arrival at your stop, the trip length and the minutes until it leaves, with the next train marked. Tap one and you get every stop on the way with its time.
Copying the PDF would have meant typing every time in it. From General Lemos alone there are 93 weekday departures, each with a time at 23 stations. That's over 2,100 times for one direction on weekdays, before Saturdays, Sundays and the trip back, and all of it again whenever Metrovías changes the schedule.
🧮 STORE LESS, WORK OUT THE REST
Only the departures from each end of the line, plus running times. Every other time is calculated.

I stored less, and the mural itself suggested how. Each column on it is one train, and reading down the column, the gaps between stations barely change from one train to the next. So the page keeps the departures from each end of the line, plus the minutes it takes to reach each station, and works out every other time. Against Metrovías' own timetable, 65% of those worked-out times match exactly and 98% are within a minute, across 8,970 stop times. The only one more than two minutes off is a typo in the PDF itself: the 09:49 from General Lemos reaches Fernández Moreno at 10:13, between 10:21 and 10:25.
Real trains don't run exactly to the timetable either. Every time I took the train, on whatever day it was, I timed how late it ran against the page. Over about 30 trips it averaged three minutes. In June I added a line above every set of results: times may differ by plus or minus three minutes.
🔁 UPDATE WITHOUT TOUCHING THE CODE
A spreadsheet, a script and a GitHub Action.
At first I edited times straight into the page's code. On 17 March I moved them into a spreadsheet instead. One tab holds eight lists of departures, one for each direction and day type, and eight more tabs rebuild the mural's grid from them with formulas. A Python script writes the departures into the page, and GitHub runs it whenever the spreadsheet changes. Getting that to work took two days of failed runs and a parsing fix.
Its first real use was fixing my own mistake. In September I checked every departure on the page against Metrovías' PDF. Weekdays matched exactly. Sundays and holidays from Federico Lacroze didn't: from the fourth train on, the page showed times 5 to 25 minutes later than the real ones, and had since March. Someone trusting the page on a Sunday night would wait for a 22:55 that actually left at 22:40, with the next one at 23:50. I fixed it in the spreadsheet, and GitHub rebuilt the page.

🗺️ THE MAP I HID
Feedback said it didn't help them read the times.
On day two I added a map of the line: street tiles, the route drawn on top, zoom controls, and stations you could tap to pick. Three people tried it and told me the map didn't add anything to their understanding of the times, so I hid it the same day.
♿ ACCESSIBILITY
Labelled for screen readers. Not tested with one yet.
There's a skip link, every control has a label, and each result is read out as one sentence: "Próximo tren. Sale a las 17:50 de Federico Lacroze, llega 18:19 a Rubén Darío." I haven't tested it with a screen reader yet.
How I used AI
I used Claude to help me write the code, and in September I had it compare every time on the page with Metrovías' PDF, which is how the Sunday mistake turned up. The calls that shaped the page weren't Claude's. Storing only the departures came from how the mural is laid out. I hid the map because three people said it didn't help them, and the three-minute margin comes from my own timings.
Impact
No analytics ran on the page until 19 September 2026, six months after launch, so I can't say who used it before then.
📈 ABOUT 47 USERS A WEEK
Google Analytics, first week of tracking, with 32 seconds of engagement on average.
🚆 LIVE SINCE MARCH 2026
On Metrovías' winter 2026 timetable, with a spreadsheet path for the next change.
ℹ️ UNOFFICIAL, AND SAYS SO
The page says it isn't affiliated with Metrovías and points riders to the Metrovías site and phone line to check.
What I would do differently
Test it with a screen reader. I labelled every control for screen readers, and the README says it works with them, but I haven't tested it with one.
Measure from launch. Analytics went in six months late, so I can't tell whether 47 a week is growth or where it's always been.